Flipping some coins with LLMs
This experiment is not rigorous (no control on hardware/seed) and doesnt have any significance.
While LLMs theoretically understand “randomness,” their training data distributions may create unexpected patterns. In this article we will test different LLMs from OpenAI and Anthropic to see if they provide unbiased results. For the first experiment we will make it toss a fair coin and for the next, we will make it guess a number between 0-10 and see if its equally distributed between even and odd. I know the sample sizes are small and probably not very statistically significant. This whole thing is just for fun.
Experiment 1 : Tossing a fair coin
Prompt used: Toss a fair coin. Just say “heads” or “tails”. Just output the result. Don’t say anything else. Don’t write code. Don’t use any tools.
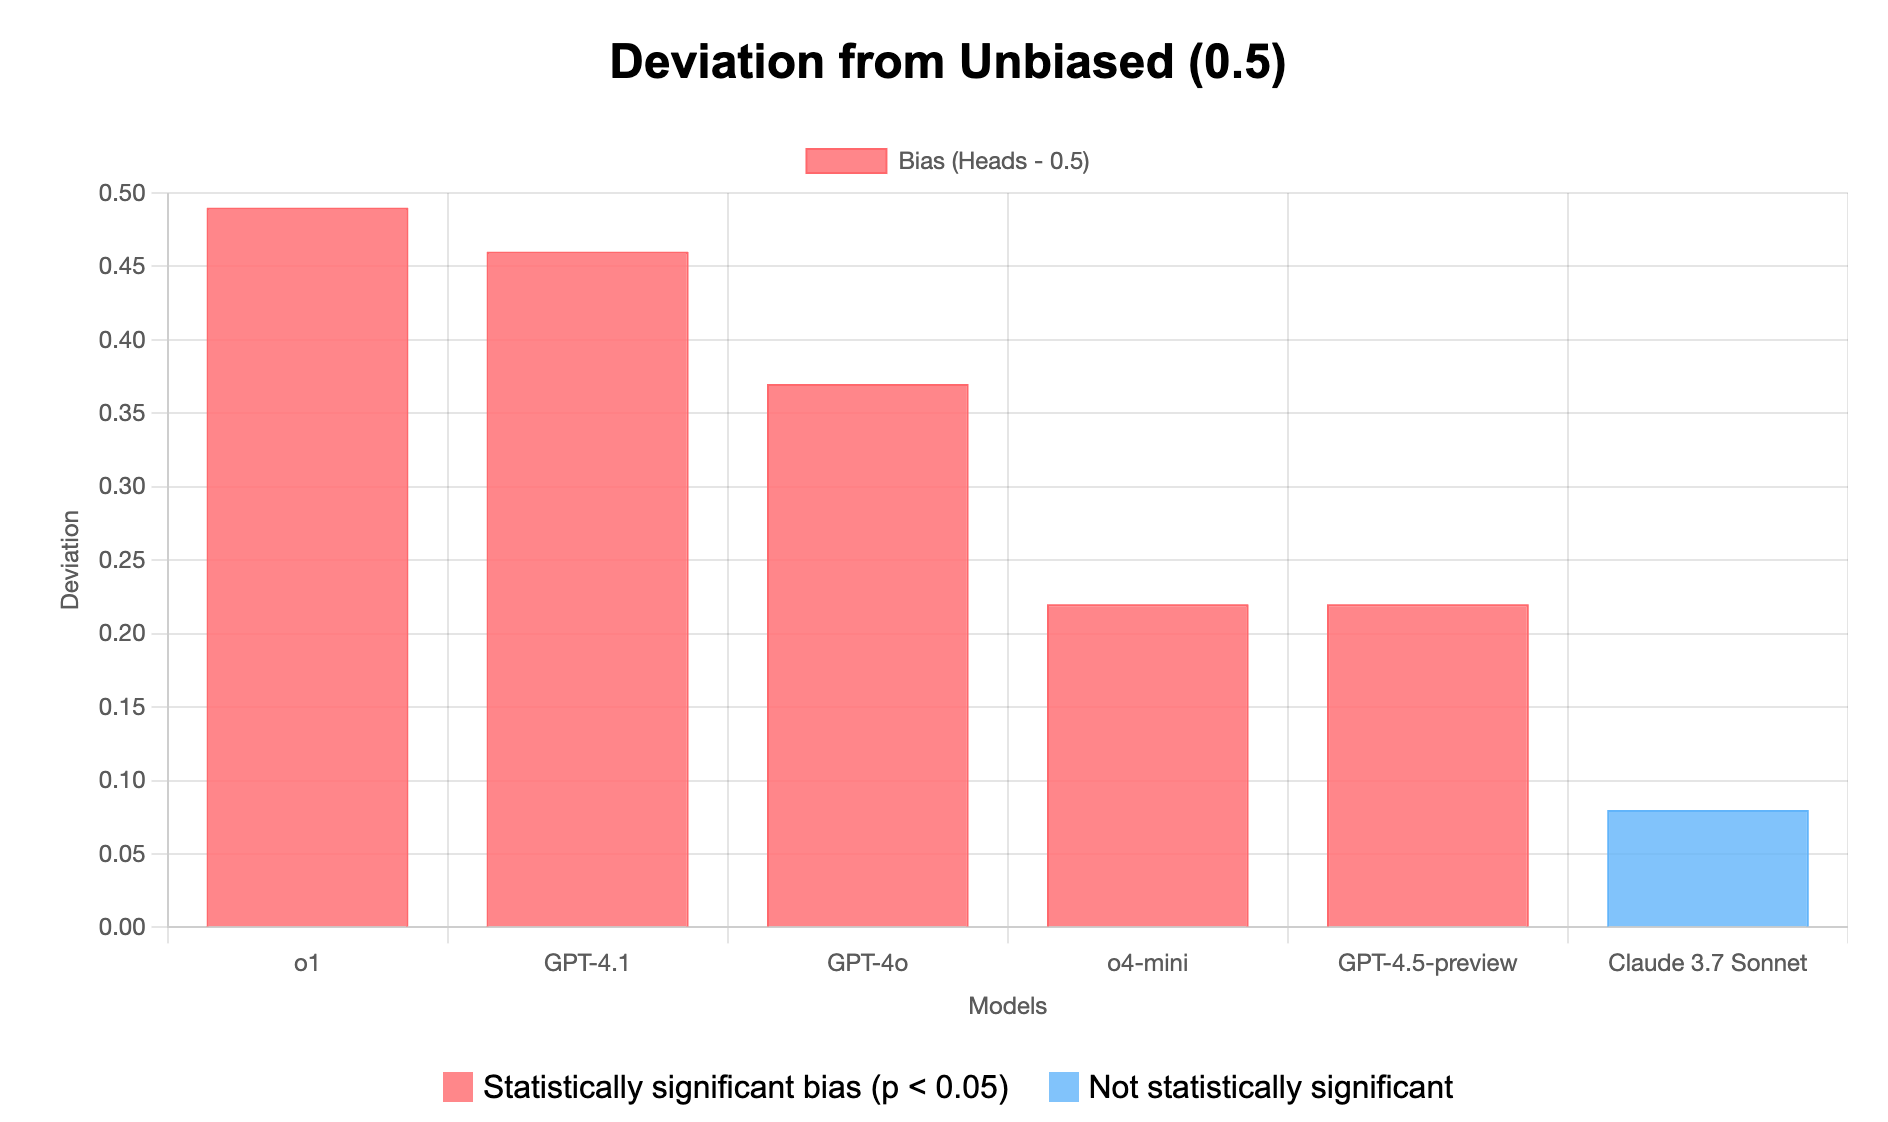
Before we plot the results, we calculate deviation. Deviation simply measures how far each model’s heads probability strays from the ideal unbiased value (0.5 or 50%). It’s calculated as:
Deviation = P(Heads) - 0.5
For example, Claude 3.7 Sonnet has P(Heads) = 0.58, so its deviation is 0.58 - 0.5 = 0.08 (or 8%). This directly quantifies bias magnitude and direction, with positive values indicating heads bias and negative values indicating tails bias. The first graph shows raw proportions of heads vs tails, while the second graph visualizes these deviations.
Next we also do a chi-squared test to determine whether the bias is statistically significant or could reasonably occur by chance. I know we don’t have a big enough sample size but I am just doing this for fun. For each model, it’s calculated as:
χ² = Σ (Observed - Expected)²/Expected
With 100 tosses per model and an expected 50/50 split:
χ² = (Observed_Heads - 50)²/50 + (Observed_Tails - 50)²/50
For Claude 3.7 Sonnet:
χ² = (58 - 50)²/50 + (42 - 50)²/50 = 2.56
A χ² value greater than 3.84 (critical value for df=1, p=0.05) indicates statistical significance. Models with statistically significant bias are shown in red in the deviation graph, indicating their bias likely reflects an inherent trait rather than random chance. Claude’s χ² = 2.56 falls below this threshold, suggesting its observed bias could reasonably occur by random variation.
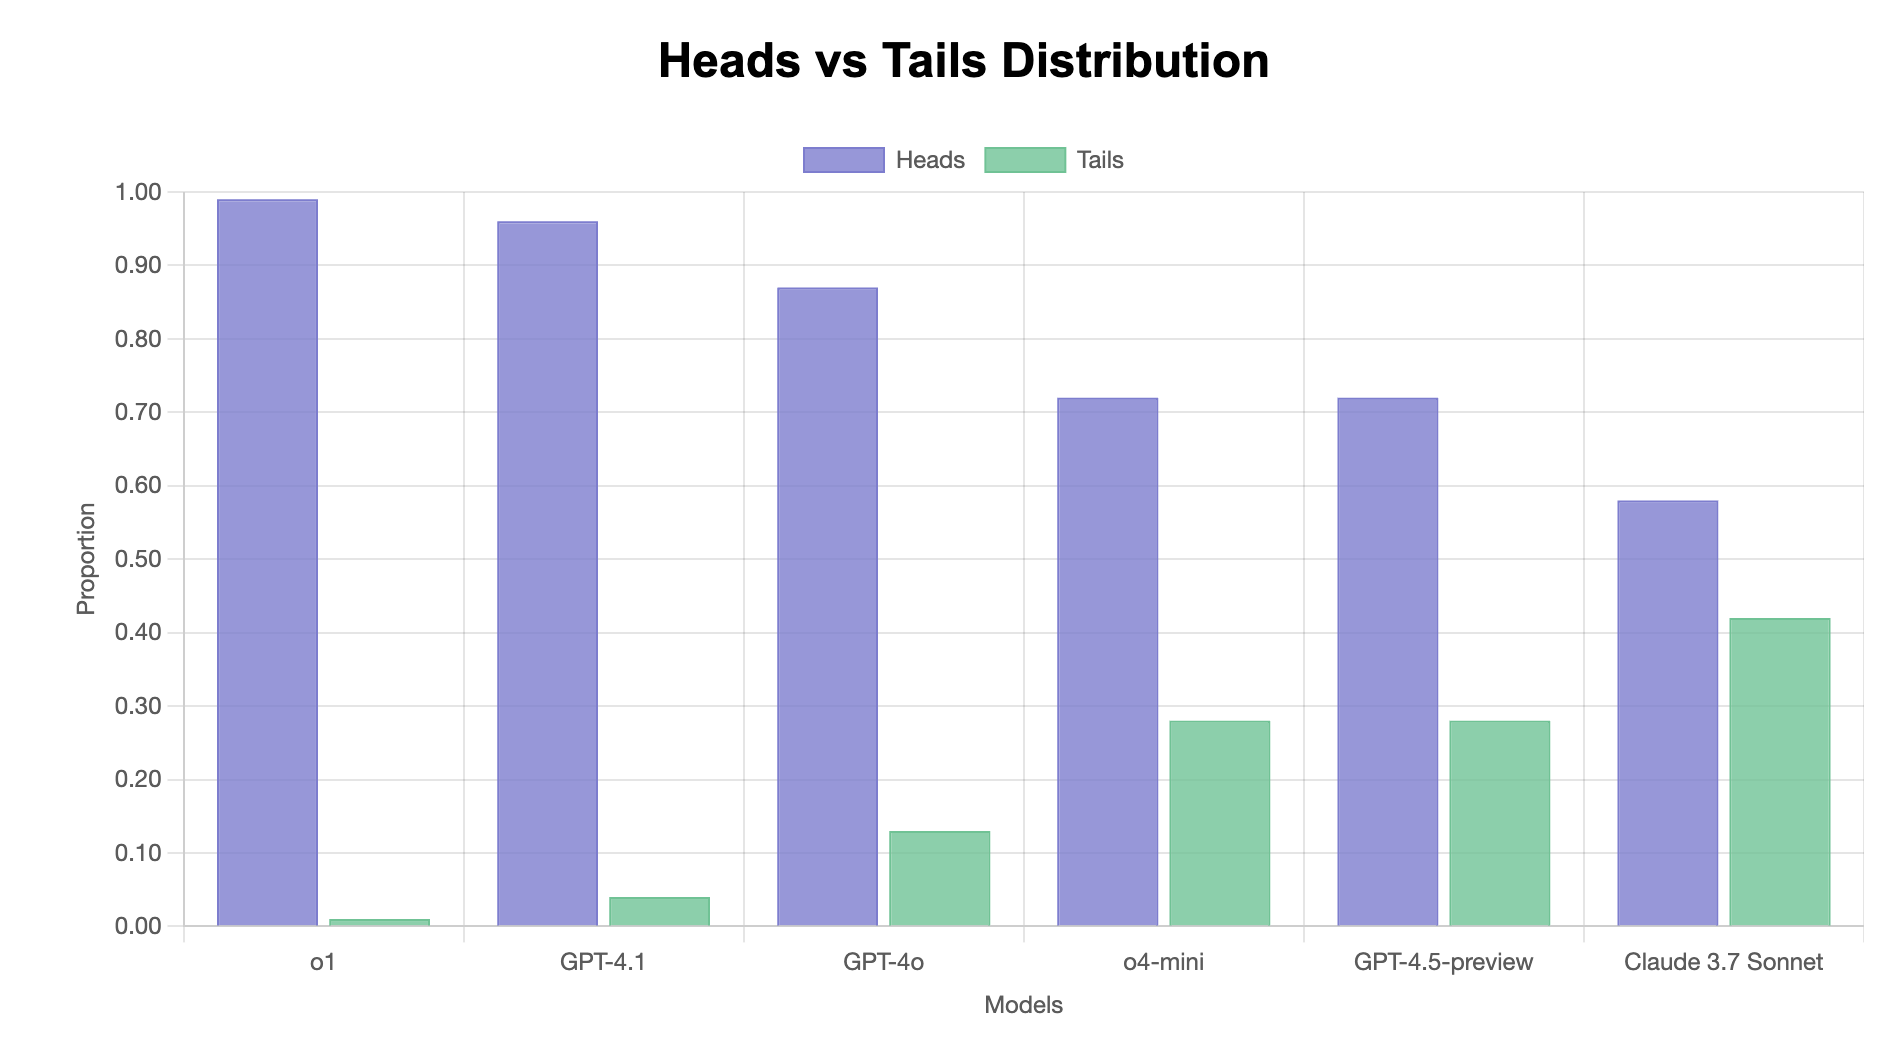
Key Findings:
- All models show “heads” bias - every LLM tested produced more heads than tails
- Bias severity varies significantly - ranging from 8% (Claude) to 49% (GPT-o1)
- Statistical significance - Claude is the only model whose bias isn’t statistically significant
- OpenAI models show substantially stronger heads bias than Claude
Analysis Details:
- Most biased: o1 (99% heads) and GPT-4.1 (96% heads)
- Least biased: Claude 3.7 Sonnet (58% heads)
- Average bias: 30.7% deviation from perfect balance
- Chi-square tests confirm statistical significance for all models except Claude
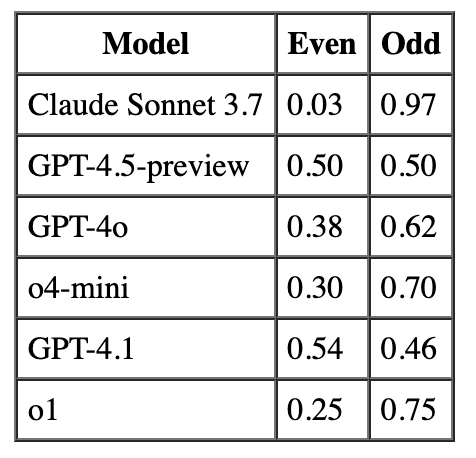
Experiment 2 : Odd vs even
Prompt used: Generate a random number between 1 and 10 (both inclusive). Just output the number. Don’t say anything else. Don’t write code. Don’t use any tools. Don’t explain. Don’t output anything except the number.
Now we repeat the same analysis as above and plot the numbers.
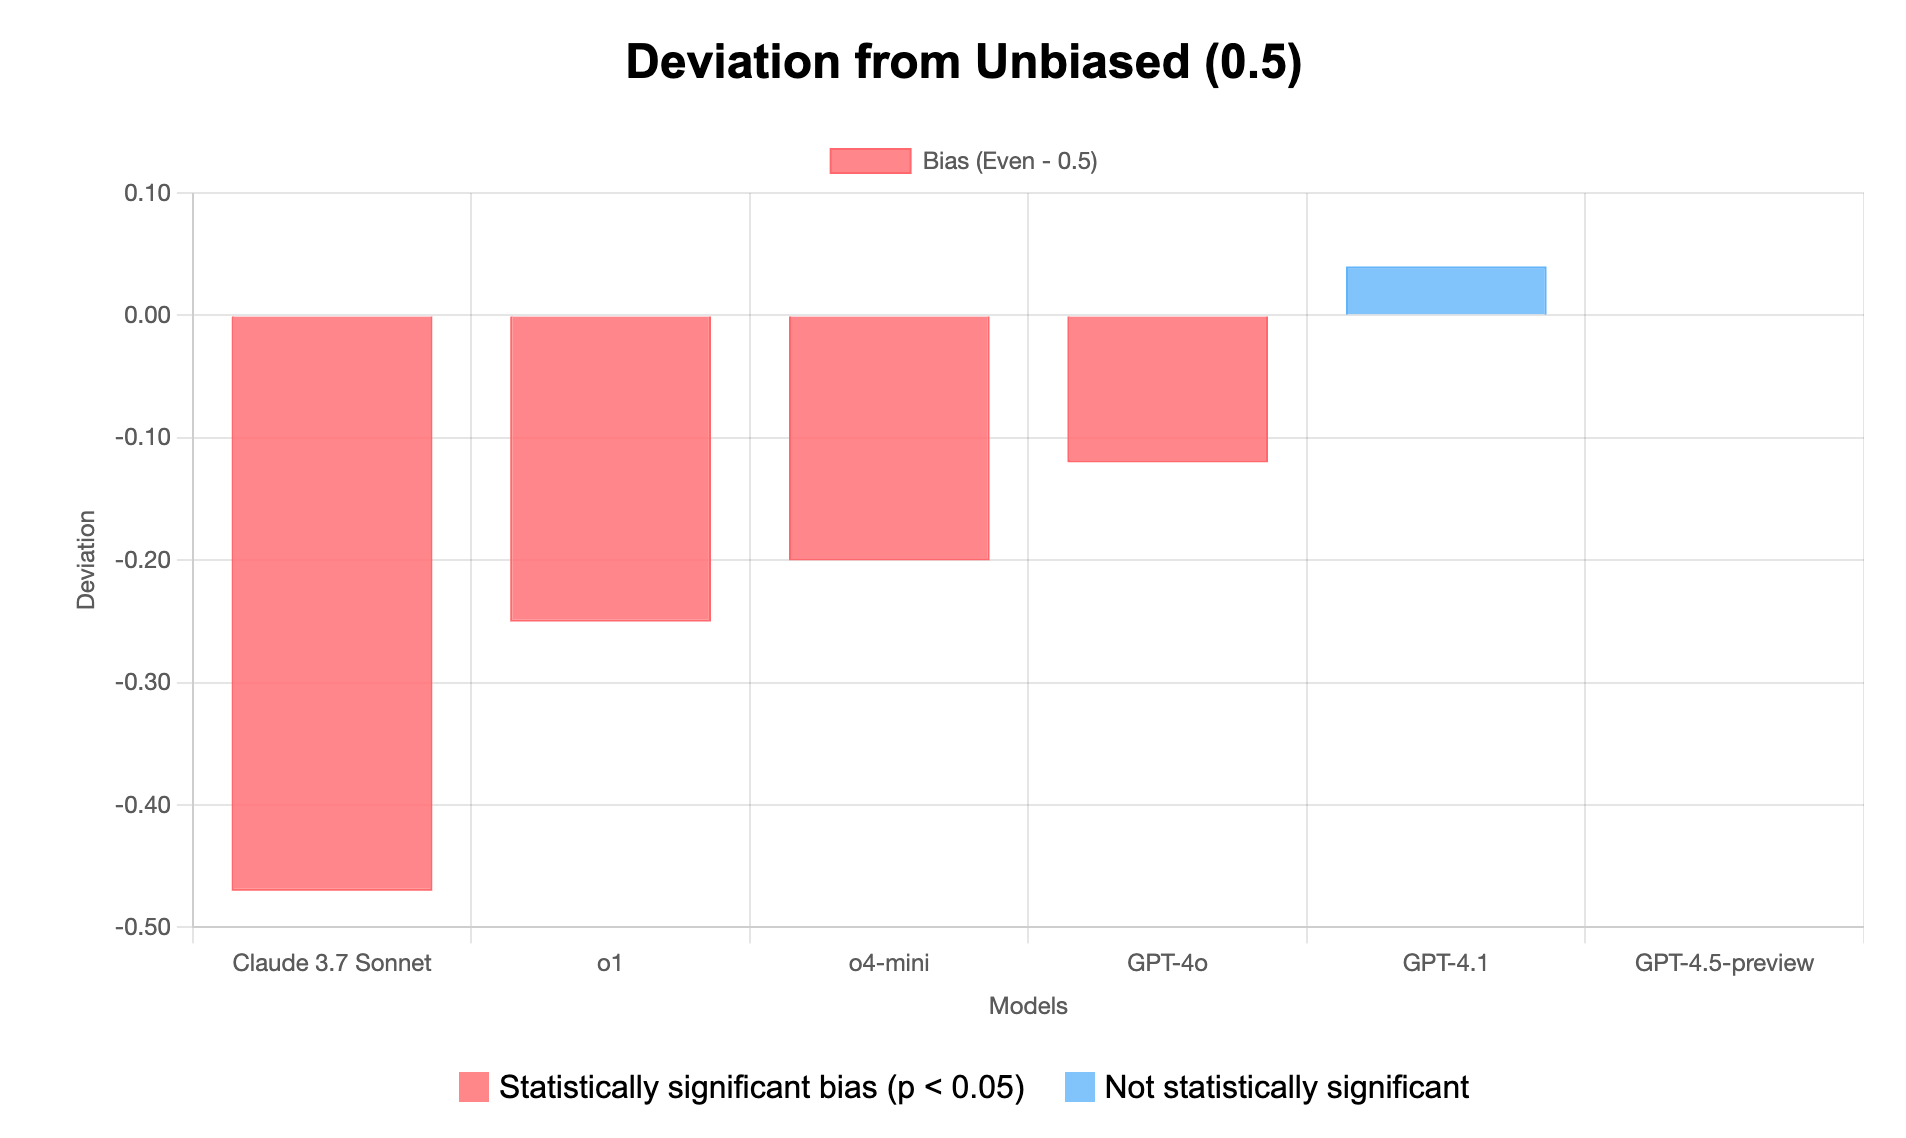
Key Findings:
- Strong odd number bias in most models - 4 out of 6 models show statistically significant preference for odd numbers
- Claude shows extreme bias - With 97% odd numbers, Claude 3.7 Sonnet has the strongest bias (47% deviation from expected)
- GPT-4.5 shows perfect balance - Exactly 50/50 distribution between odd and even
- Two unbiased models - GPT-4.5-preview and GPT-4.1 show no statistically significant bias
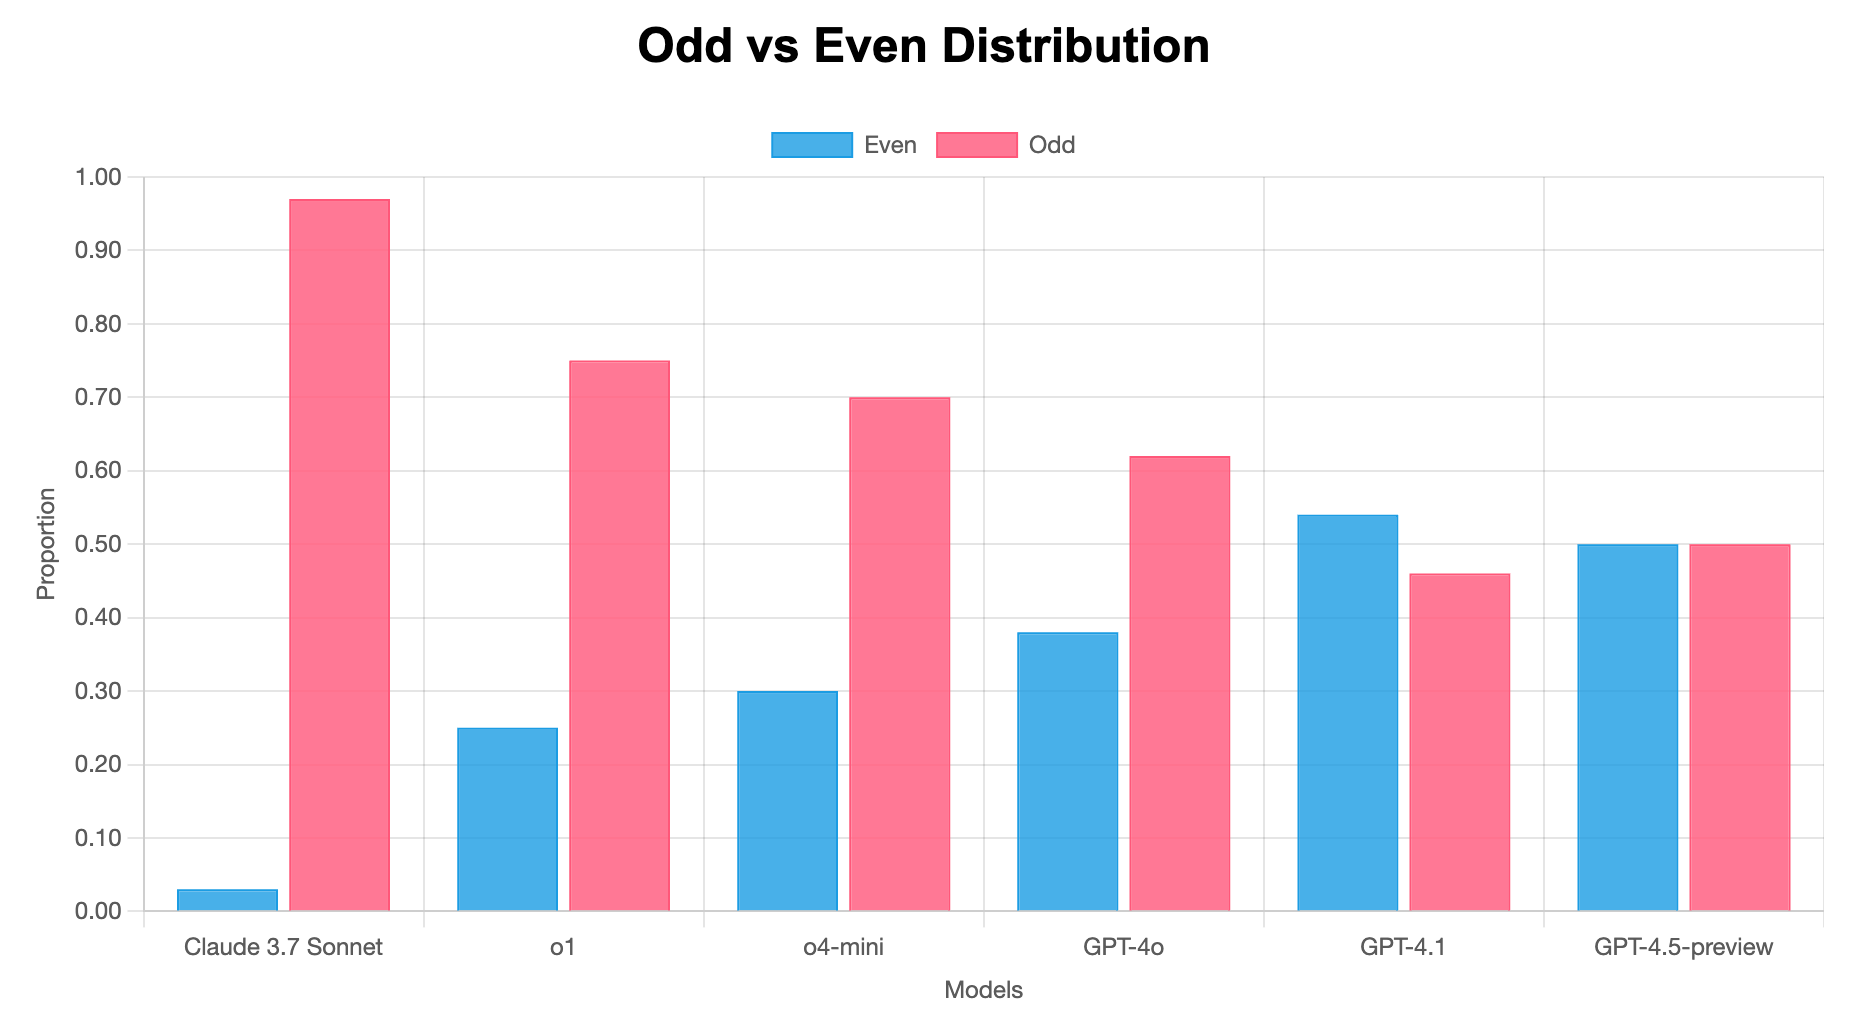
Statistical Analysis:
- Most biased: Claude 3.7 Sonnet (χ² = 88.36, p < 0.05)
- Perfectly balanced: GPT-4.5-preview (χ² = 0.00)
- Average bias magnitude: 18.0% deviation from expected 50/50 split
- Direction of bias: Most models favor odd numbers, while GPT-4.1 slightly favors even numbers
Its interesting to see Claude being unbiased while tossing coins but being super biased when prediction odd/even numbers.
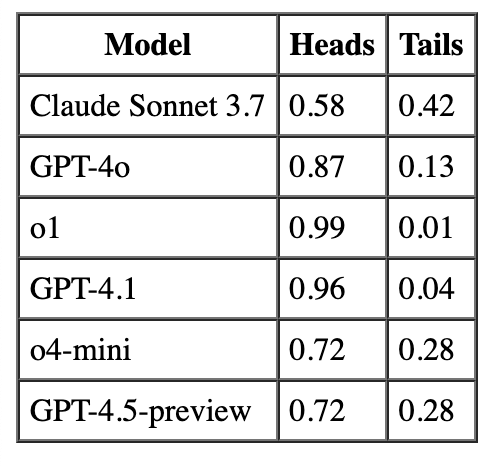
Raw data
Coin toss
Odd vs Even